

How ‘standard’ is the world, assume a can opener!
It goes without saying that statistics are a very powerful instrument, but as it goes with many elegant instruments it is very tempting to also apply it in cases where it is not appropriate.
100% correlation between sense and nonsense
Correlations can support hypotheses, but not the other way around.
If we do some ‘logical’ thinking, we may suspect that there is a relationship between the calorie intake and the average weight of a person. Our hypothesis can be easily confirmed by a simple experiment to prove that the two clearly correlate.
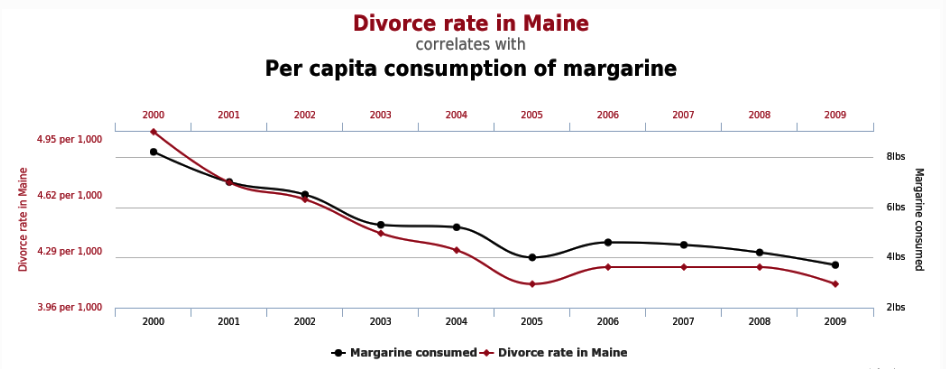
But if we turn this process around, then we can simply demonstrate that there is a strong statistical relationship between the increasing number of phone connections and the increase in cancer rates, being that they both have a linear ascending pattern over time. After all if both the number of phone connections and the number of cancer cases are increasing over time, then if we correlate them it will also show a strong relationship. There is even a separate website with examples of absurd and spurious correlations. As we can see, it is better to be very careful with the use of margarine in the American state Maine, that is if we want to preserve our marriage.
Extremistan and Mediocrystan
In his excellent book The Black Swan, what should be mandatory for many studies, universities and colleges, Taleb presents two different worlds. We have Mediocrystan, which is a limited world where averages and statistics work well (the world of Gauss) and there is Extremistan, the world where averages and statistics lead to absurd and false conclusions.
The difference between the two can be best illustrated by taking you on a brain exercise.
If we randomly choose the first 1,000 people that we run into and measure their weight and length, we can then see that on average these people are 1.71 meters in height and weigh 60 kg (n=1000). Now, you may search the whole world over and select the tallest person and the heaviest person on earth and add them to this population (let’s say 300 kg and 3 meters, n=1002). As it turns out both people have a negligible effect on the average weight or length of the population. A perfect example of a standard distributed world: Mediocrystan.
Now we take the same randomly chosen population of 1,000 and calculate their average yearly income. We may expect that this figure (in Holland at least) will be somewhere around € 32,000 per year. If we now search the world for the richest person on earth and add the yearly income of Bill Gates to our population, all of a sudden the average income suggests that we have a population containing a thousand-and-one millionaires: welcome to Extremistan!!!
Assume ‘a can opener’
After being shipwrecked a technician, a theoretical physicist and an economist/statistician are drifting ashore on an uninhabited island accompanied by a can of beans. Torn by hunger they sit together to discuss their options as to how to open that can of beans.
The technician immediately thinks about using a broken branch to create leverage to break the can with mechanical violence. The theoretical physicist wants to explore the lens effect of a pool of water and with a lot of endurance try to burn a whole in the can by keeping it in the focal point of the lens. When the statistician/economist starts to share his view on how to deal with the can of beans he takes off with . . . . . “assume a can opener!”
As a joke the above story might not be too humurous, however as a demonstration of what happens on a great scale, without us being aware of that, it is very powerful. Assume a solution and there is no problem.
Where for any well thinking human being the assumption in this case of a can opener is preposterous, this is far less the case when we are confronted with “assume a standard distribution.”
In most cases standard is seldom ‘standard’
When I was still a Director Operations I once asked a young and ambitious Industrial Engineer to assess the number of pallet locations we would need in our factory if we would make our future projections in terms of sales and production.
After an intense in-depth study and the production of a large spreadsheet, he had calculated how many pallet location were needed. Beware a spreadsheet does give the illusion of accuracy.
Interested in his findings I asked him about his assumptions that he made up front. As it turned out and without him being aware of it he had run through two red lights!
He had assumed that the yearly sales and production were spread evenly across the year, whilst our company had a serious seasonal pattern being active in the construction business. Next to that he had assumed that the inventory at the different consecutive work centers in the factory (the product to be) during the week would be constant, while along the line there were work centers working in a one day shift (8 hours/5days), some in a two or three shift system and last but not least there was the inline bottleneck, operating 24/7.
So even if the total demand for the factory would have followed a standard distribution pattern and we could calculate with the average volume per week, the daily demand and supply of the different consecutive work centers would straight away spoil this distribution.
If a work center operates in one shift and supplies a second work center that operates in two shifts, it produces during its working hours twice as much as the other is consuming. During the day the first work center accumulates sufficient inventory for the second work center to get through the second shift. Likewise at the end of the five day working week, all workers of the supplying work centers go off to celebrate their weekend leaving a sufficiently large pile of stocks for the bottleneck to operate the full weekend without any extra supply. So it is obvious that during the week the needed pallet locations per work center differ immensely.
Apply statistics when there is no suitable alternative
Experience show that for most questions and many analyses, it is much better and appropriate to just ask, to make a phone call, to look, to experiment in order to see whether an answer can be found instead of seeking the answer by doing statistical calculations.
Having said that we must realize that for example in the field of the consumer marketing we cannot interview all potential consumers, nor can we easily detect patterns in the quality control measurements in large-scale, high-volume processes. Hence the instrument of statistics does play a vital and crucial role. However before we apply statistics it is absolutely vital to see whether we are in Mediocrystan and that we have a sufficient amount of data.
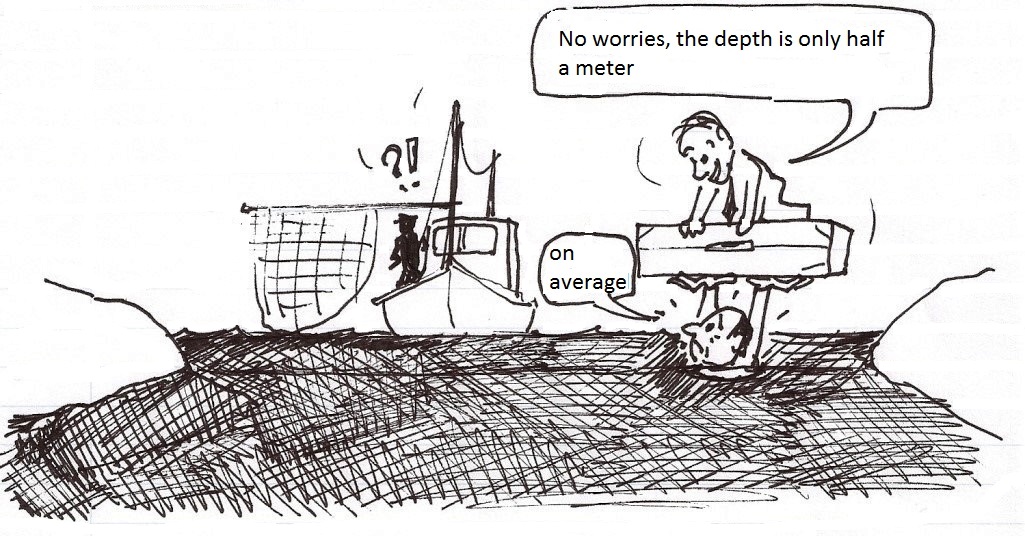
The famous Dutch author Godfried Bomans illustrated the danger of using averages without any scrutiny fittingly: “A statistician once was wading through a river of one meter deep on average . . . he drowned” (a cause of death if one assumes Mediocrystan and it turned out to be Extremistan).
Veghel, augustus 2016


